Congress Vice President Sh. Rahul Gandhi, while addressing the valedictory session of 86th AGM of FCCI on Saturday, termed corruption as the biggest issue that was bleeding people and lauded the UPA Government's achievement of passing the land mark Lokpal Bill to fight it. 'The real issue frankly in all these things whether its environment, whether its land acquisition, its arbitrary power. So if you create rules frame work and you take away arbitrary power a lot of these problems will be mitigated.' Rahul Gandhi added while answering the question..

Congress Vice President Sh. Rahul Gandhi, while addressing the valedictory session of 86th AGM of FCCI on Saturday, termed corruption as the biggest issue that was bleeding people and lauded the UPA Government's achievement of passing the land mark Lokpal Bill to fight it. 'The real issue frankly in all these things whether its environment, whether its land acquisition, its arbitrary power. So if you create rules frame work and you take away arbitrary power a lot of these problems will be mitigated.' Rahul Gandhi added while answering the question.
News video | 783 views

FusionCharts offered us a clean and dynamic way of displaying information on our site.
In this Fusion Charts Tutorial, we will give you a demonstration on Interactive Fusion Chart.
www.bisptrainings.com, www.bispsolutions.com
For consulting visit: https://www.bispsolutions.com/custom-developement-using-python/
For training visit: https://www.bisptrainings.com/Courses/Data-Science-certification-Training
Email Us: support@bispsolutions.com
Call us: +91 7694095404 or +1 786-629-6893
Follow us on Facebook: https://www.facebook.com/bisptrainings/
Follow us on Twitter: https://twitter.com/bisptrainings
Follow us on Linkedin: https://www.linkedin.com/company/13367555/admin/
Fusion Chart Interactive | Fusion Chart Tutorial | Fusion Chart Training | Interactive Fusion Chart
Education video | 17027 views
In this video tutorial, you will learn how to create advance charts using High Chart. Here I've created a world map chart.
World Map Chart Using High Charts | Python WorldMap Chart | Python Advance Chart | Lead Analytics
Education video | 767 views

In this video tutorial, we discussed fusion chart hands on and concept . It is part of Data Science Project Called Lead Analytics. In this project Business Leads are captured and visualized. we will explain Python with Fusion Chart. We will give you a demonstration on Fusion Chart Introduction.
www.bisptrainings.com, www.bispsolutions.com
For consulting visit: https://www.bispsolutions.com/custom-developement-using-python/
For training visit: https://www.bisptrainings.com/Courses/Data-Science-certification-Training
Email Us: support@bispsolutions.com
Call us: +91 7694095404 or +1 786-629-6893
Follow us on Facebook: https://www.facebook.com/bisptrainings/
Follow us on Twitter: https://twitter.com/bisptrainings
Follow us on Linkedin: https://www.linkedin.com/company/13367555/admin/
Fusion Chart Introduction | Fusion Chart Hands On | Python Fusion Chart | Advance Data Visualization
Education video | 1130 views

A Fusion bar chart represents quantitative information. The chart consists of horizontal bars of equal width with lengths proportional to the values they represent, something that aids in instant comparison of data. One axis of the chart plots categories and the other axis represents the value scale.
In this video tutorial, we discussed Advance Fusion Chart
www.bisptrainings.com, www.bispsolutions.com
For consulting visit: https://www.bispsolutions.com/custom-developement-using-python/
For training visit: https://www.bisptrainings.com/Courses/Data-Science-certification-Training
Email Us: support@bispsolutions.com
Call us: +91 7694095404 or +1 786-629-6893
Follow us on Facebook: https://www.facebook.com/bisptrainings/
Follow us on Twitter: https://twitter.com/bisptrainings
Follow us on Linkedin: https://www.linkedin.com/company/13367555/admin/
Fusion Bar Chart | Advance Fusion Chart | BISP Data Analytics | Fusion Chart Consulting
Education video | 17087 views

This chart helps in displaying the cumulative magnitude of two or more datasets. The length of each stack in a bar is proportionate to its value. Datasets in a stack are distinguished by their color; an icon legend is rendered at the bottom of the chart to map data plots to their corresponding data categories; the icons can be clicked to show/hide data plots.
In this Fusion Chart Learning Series, we will explain Fusion Chart Stacked Bar.
www.bisptrainings.com, www.bispsolutions.com
For consulting visit: https://www.bispsolutions.com/custom-developement-using-python/
For training visit: https://www.bisptrainings.com/Courses/Data-Science-certification-Training
Email Us: support@bispsolutions.com
Call us: +91 7694095404 or +1 786-629-6893
Follow us on Facebook: https://www.facebook.com/bisptrainings/
Follow us on Twitter: https://twitter.com/bisptrainings
Follow us on Linkedin: https://www.linkedin.com/company/13367555/admin/
Fusion Chart Stacked Bar | Fusion Chart Learning Series | Fusion Chart Project
Education video | 16972 views
Love Astrology Compatibility chart Analysis Indian Astrology Chart +91-96941402888 in uk usa delhi
Love Astrology Compatibility chart Analysis Indian Astrology Chart +91-96941402888 in uk usa delhi
Vlogs video | 1111 views

Love Astrology Compatibility chart Analysis Indian Astrology Chart +91-96941402888 in uk usa delhi
Love Astrology Compatibility chart Analysis Indian Astrology Chart +91-96941402888 in uk usa delhi
Vlogs video | 835 views

Follow the full step by step OBIEE training tutorial at: http://www.bisptrainings.com/course/Oracle/OBIEE
Watch Google Chart in OBIEE | Google Chart With HD Quality
Education video | 565 views
Top 10 Hindi Serial TRP Chart Of This Week।।TRP CHART OF (22june-28june)2018|| Delhi Darpan TV
For More Latest News Update Do Not Forget To Subscribe
Watch Top 10 Hindi Serial TRP Chart Of This Week।।TRP CHART OF (22june-28june)2018|| Delhi Darpan TV With HD Quality
Entertainment video | 1268 views

Subscribe to my Vlog Channel - Nidhi Katiyar Vlogs
https://www.youtube.com/channel/UCVgQXr1OwlxEKKhVPCTYlKg
-----------------------------------------------------------------------------------------------------------------------------
My Referal Codes -
Plum Goodness -
Use code - NK15 for 15% off
https://plumgoodness.com/discount/NK15
Re'equil - Use Code - NIDHIKATIYAR FOR 10%OFF
https://bit.ly/3ofrJhl
Mamaearth - Use Code nidhi2021 for 20% off
colorbar cosmetics - CBAFNIDHIKA20
Watch My other Vlogs -
https://www.youtube.com/watch?v=ih_bKToLC3g&list=PLswt2K44s-hbKsvEBLEC5fHDkEp7Wwnpd
Watch My Disney Princess to Indian Wedding Series here - Its fun to watch Indian Avatar of Disney Princesses -
https://www.youtube.com/watch?v=lPkRbupcUB0&list=PLswt2K44s-haUOABjzzUOG2jwUh_Fpr96
Watch My Monotone Makeup Looks Here -
https://www.youtube.com/watch?v=WrpPx-_F1Yw&list=PLswt2K44s-hZOfXt-sSQlVe7C_vBOjsWQ
Love Affordable Makeup - Checkout What's new in Affordable -
https://www.youtube.com/watch?v=lowjaZ9kZcs&list=PLswt2K44s-hZcQ-tZUr7GzH0ymkV18U8o
Here is my Get UNREADY With Me -
https://www.youtube.com/watch?v=aLtDX9l8ovo&list=PLswt2K44s-hbLjRz8rtj8FTC-3tZ55yzY
-----------------------------------------------------------------------------------------------------------------------------------
Follow me on all my social media's below:
email :team.nidhivlogs@gmail.com
Facebook: https://www.facebook.com/prettysimplenk/
Twitter : https://twitter.com/nidhikatiyar167
Instagram - https://www.instagram.com/nidhi.167/
Shop affordable Makeup here -
https://www.cuffsnlashes.com
------------------------------------------------------------------------------------------------------------------------------
Shop affordable Makeup here -
https://www.cuffsnlashes.com
Subscribe to my other channel 'Cuffs
Beauty Tips video | 17132 views

Styling Pakistani suit from @Meesho #shorts #meeshosuithaul #pakistanisuits #meeshokurti
Beauty Tips video | 2933 views
Barbie makeup- cut crease eye look - pink makeup for beginners #shorts #cutcrease #pinkeyelook Flat 25% off on Cuffs n Lashes entire range + free gift on all orders above 299
Cuffs n Lashes X Shystyles eyeshadow Palette - Seductress https://www.purplle.com/product/cuffs-n-lashes-x-shystyles-the-shystyles-palette-12-color-mini-palette-seductress
Cuffs n Lashes Eyelashes - Pink City - https://www.purplle.com/product/cuffs-n-lashes-5d-eyelashes-17-pink-city
Cuffs n Lashes Cover Pot - Nude - https://www.purplle.com/product/cuffs-n-lashes-cover-pots-nude
Cuffs n Lashes F021 Fat top brush - https://www.purplle.com/product/cuff-n-lashes-makeup-brushes-f-021-flat-top-kabuki-brush
Cuffs n Lashes x Shsytyeles Brush - https://www.purplle.com/product/cuffs-n-lashes-x-shystyles-makeup-brush-cs01-flat-shader-brush
Cuffs n Lashes Flat shader Brush E004 - https://www.purplle.com/product/cuff-n-lashes-makeup-brushes-e004-big-lat-brush
Barbie makeup- cut crease eye look - pink makeup for beginners #shorts #cutcrease #pinkeyelook
Beauty Tips video | 3109 views

Latte Makeup but with Indian touch #shorts #lattemakeup #viralmakeuphacks #viralmakeuptrends #makeup
Beauty Tips video | 2606 views
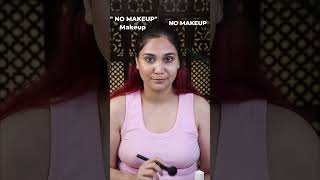
No Makeup vs No Makeup Makeup look #shorts #nomakeupmakeup #nofilter #naturalmakeup #everydaymakeup
Beauty Tips video | 3079 views

The Purplle I Heart Beauty Sale goes live on the 2nd of August!
BUY 1 GET 1 FREE on all mCaffeine products.
mCaffeine Cherry Affair - Coffee Face Mist - https://mlpl.link/INFIwj2Q
mCaffeine On The Go Coffee Body Stick - https://mlpl.link/INF3lvBa
Download the Purplle app here:
https://mlpl.link/JCCZ2INF
Subscribe to my Vlog Channel - Nidhi Katiyar Vlogs
https://www.youtube.com/channel/UCVgQXr1OwlxEKKhVPCTYlKg
-----------------------------------------------------------------------------------------------------------------------------
Watch My other Vlogs -
https://www.youtube.com/watch?v=ih_bKToLC3g&list=PLswt2K44s-hbKsvEBLEC5fHDkEp7Wwnpd
Watch My Disney Princess to Indian Wedding Series here - Its fun to watch Indian Avatar of Disney Princesses -
https://www.youtube.com/watch?v=lPkRbupcUB0&list=PLswt2K44s-haUOABjzzUOG2jwUh_Fpr96
Watch My Monotone Makeup Looks Here -
https://www.youtube.com/watch?v=WrpPx-_F1Yw&list=PLswt2K44s-hZOfXt-sSQlVe7C_vBOjsWQ
Love Affordable Makeup - Checkout What's new in Affordable -
https://www.youtube.com/watch?v=lowjaZ9kZcs&list=PLswt2K44s-hZcQ-tZUr7GzH0ymkV18U8o
Here is my Get UNREADY With Me -
https://www.youtube.com/watch?v=aLtDX9l8ovo&list=PLswt2K44s-hbLjRz8rtj8FTC-3tZ55yzY
-----------------------------------------------------------------------------------------------------------------------------------
Follow me on all my social media's below:
email :team.nidhivlogs@gmail.com
Facebook: https://www.facebook.com/prettysimplenk/
Twitter : https://twitter.com/nidhikatiyar167
Instagram - https://www.instagram.com/nidhi.167/
Shop affordable Makeup here -
https://www.cuffsnlashes.com
------------------------------------------------------------------------------------------------------------------------------
Shop affordable Makeup here -
https://www.cuffs
Beauty Tips video | 2794 views